My Journey to analytics
- Kenneth Li
- Dec 31, 2016
- 2 min read
Welcome to Li's analytics!
The reason why I start to write a blog for analytics is very simple: to promote analytics.
My very first task in data analysis could trace back to the undergraduate thesis. I was working with a team of three to analyze large set of social network data and trying to find out the relationship of being friends and their location trajectory. At that time, we used very traditional tools like excel, java and matlab to do the data preparation, the presentation is full of codes. Luckily, we still used some charts to explain the concept.


After graduation, I never think of stepping into the analytics space because all I know about analytics is coding and crunching rocket science. One day, I learnt some products in the market named QlikView, QlikSense, Alteryx and Tableau (Of course there are many more products available but I begin with these few products). I was shocked and wish I knew these products when I was struggling how to solve the problem by writing codes with the team.
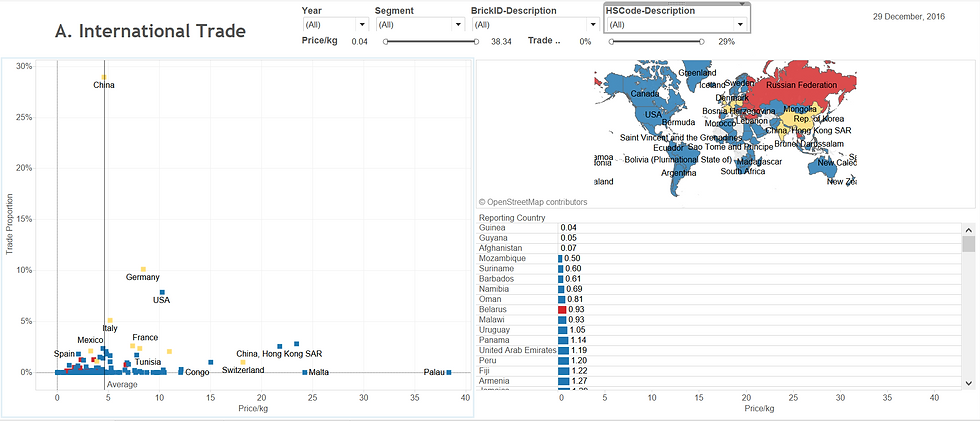
Then I started the data journey again! With QlikSense, Alteryx and Tableau, life is so much easier and the value created is completely out of my expectation. Some very sophisticated solutions can be created with interactive charts or map. And you can download and prepare the data through intuitive workflow with Alteryx.
(Tableau)

(QlikSense)

(Alteryx)

So I spent about 2 years with these products and assisted various companies to make better decisions on their business. I will share the experiences in using these software and hopefully, drive more people who are interested in analytics to understand more how it works in real business.


Comments